Tracking Synology Shared Folder Sizes Over Time
A bash script, InfluxDB, and Grafana to turn Synology shared folder sizes into trend data you can actually act on.
Justin Wyne / May 15, 2026
The built-in Synology Storage Analyzer will tell you what's taking up space right now, but it doesn't give you trend data on a shared folder level. Even with the scheduled reports, it's not easy to track which folders are growing over time and at what rate. This makes it hard to proactively manage storage and identify potential issues before they become problems.
I came up with my own solution that uses a simple bash script to collect shared folder sizes and write them to InfluxDB. Grafana then reads from InfluxDB to graph the data. It's overkill for this use case, but I already have NodeExporters sending CPU and RAM metrics to InfluxDB, so it was easy to add this on the side. If you don't already have this, it's probably not worth setting up just for this, but maybe it will give you some ideas for making your own solution.
Architecture
The Script
Save this to /usr/local/synology-scripts/synology_folder_sizes.sh on your NAS. Fill in the five variables at the top. gist link
1#!/bin/bash23# =============================================================4# synology_folder_sizes.sh5# Collects shared folder sizes and writes to InfluxDB v26# Schedule in DSM Task Scheduler (e.g. every 1-4 hours)7# =============================================================89INFLUX_URL="http://INFLUXDB_HOST_HERE:8086"10INFLUX_ORG="INFLUXDB_ORG_HERE"11INFLUX_BUCKET="INFLUXDB_BUCKET_HERE"12INFLUX_TOKEN="PUT_INFLUXDB_TOKEN_HERE"13HOSTNAME="PUT_HOSTNAME_HERE"1415log() { echo "[$(date '+%H:%M:%S')] $*"; }1617log "Starting synology_folder_sizes.sh"1819TIMESTAMP=$(date +%s)20log "Timestamp: $TIMESTAMP"2122PAYLOAD=""23COUNT=024SKIPPED=02526SHARES=$(synoshare --enum ALL 2>/dev/null | tail -n +2)27TOTAL=$(echo "$SHARES" | grep -c .)28log "Found $TOTAL shares"2930while IFS= read -r share; do31[ -z "$share" ] && continue3233SHARE_PATH=$(synoshare --get "$share" 2>/dev/null | grep "Path" | sed 's/.*\[\(.*\)\]/\1/')3435if [ -z "$SHARE_PATH" ]; then36log " SKIP $share — could not get path"37SKIPPED=$(( SKIPPED + 1 ))38continue39fi4041if [ ! -d "$SHARE_PATH" ]; then42log " SKIP $share — path does not exist: $SHARE_PATH"43SKIPPED=$(( SKIPPED + 1 ))44continue45fi4647VOLUME=$(echo "$SHARE_PATH" | cut -d'/' -f2)48SIZE_KB=$(du -xsk "$SHARE_PATH" 2>/dev/null | awk '{print $1}')4950if [ -z "$SIZE_KB" ]; then51log " SKIP $share — du failed on $SHARE_PATH"52SKIPPED=$(( SKIPPED + 1 ))53continue54fi5556SAFE_SHARE=$(echo "$share" | tr ' ' '_')57log " OK $share -> $SHARE_PATH ($SIZE_KB kb)"5859PAYLOAD="${PAYLOAD}synology_folder,host=${HOSTNAME},folder=${SAFE_SHARE},volume=${VOLUME} size_kb=${SIZE_KB} ${TIMESTAMP}60"6162COUNT=$(( COUNT + 1 ))63done <<< "$SHARES"6465log "Collected $COUNT folders, skipped $SKIPPED"6667if [ -n "$PAYLOAD" ]; then68log "Writing to InfluxDB..."69HTTP_STATUS=$(curl -s -o /tmp/influx_response.txt -w "%{http_code}" \70-X POST "${INFLUX_URL}/api/v2/write?org=${INFLUX_ORG}&bucket=${INFLUX_BUCKET}&precision=s" \71-H "Authorization: Token ${INFLUX_TOKEN}" \72--data-raw "$PAYLOAD")7374RESPONSE=$(cat /tmp/influx_response.txt)7576if [ "$HTTP_STATUS" = "204" ]; then77log "Success! HTTP $HTTP_STATUS — $COUNT folders written to InfluxDB"78else79log "ERROR: HTTP $HTTP_STATUS — $RESPONSE"80fi81else82log "No data collected, nothing written"83fi8485log "Done"
How it works
- synoshare --enum ALL gets the list of all shared folders dynamically.
- For each share, synoshare --get <name> resolves the real filesystem path.
- du -xsk <path> measures the size in KB. The -x flag keeps it on one filesystem, avoiding cross-mount inflation.
- All data points are batched into a single HTTP POST to InfluxDB using the line protocol.
Each data point looks like this:
1synology_folder,host=DS923,folder=Code,volume=volume1 size_kb=123456 1746000000
InfluxDB Setup
Create a bucket named synology-shared-folders (or whatever you set in the script). Generate a write token and paste it into the INFLUX_TOKEN variable.
| Field | Value |
|---|---|
| Bucket | synology-shared-folders |
| Measurement | synology_folder |
| Tags | host, folder, volume |
| Field | size_kb |
DSM Task Scheduler
Open Control Panel → Task Scheduler and create a new scheduled task:
| Setting | Value |
|---|---|
| Type | Scheduled Task → User-defined script |
| User | root (required for synoshare) |
| Schedule | Every 24 hours for example |
| Command | bash /usr/local/synology-scripts/synology_folder_sizes.sh |
Run it once manually and check the output to confirm data is reaching InfluxDB before setting up the recurring schedule.
Grafana
Add an InfluxDB v2 data source pointing at your instance with the Flux query language selected.
For the panel, use this Flux query:
1from(bucket: "synology-shared-folders")2|> range(start: -30d)3|> filter(fn: (r) => r._measurement == "synology_folder")4|> filter(fn: (r) => r._field == "size_kb")5|> keep(columns: ["_time", "_value", "folder"])
Two panel settings that make a big difference:
- Unit: Set to Data (IEC) → kibibytes so Grafana auto-scales to KB/MB/GB/TB instead of showing raw kilobyte numbers.
- Legend: Set to {{folder}} to show the folder name instead of the full tag object.
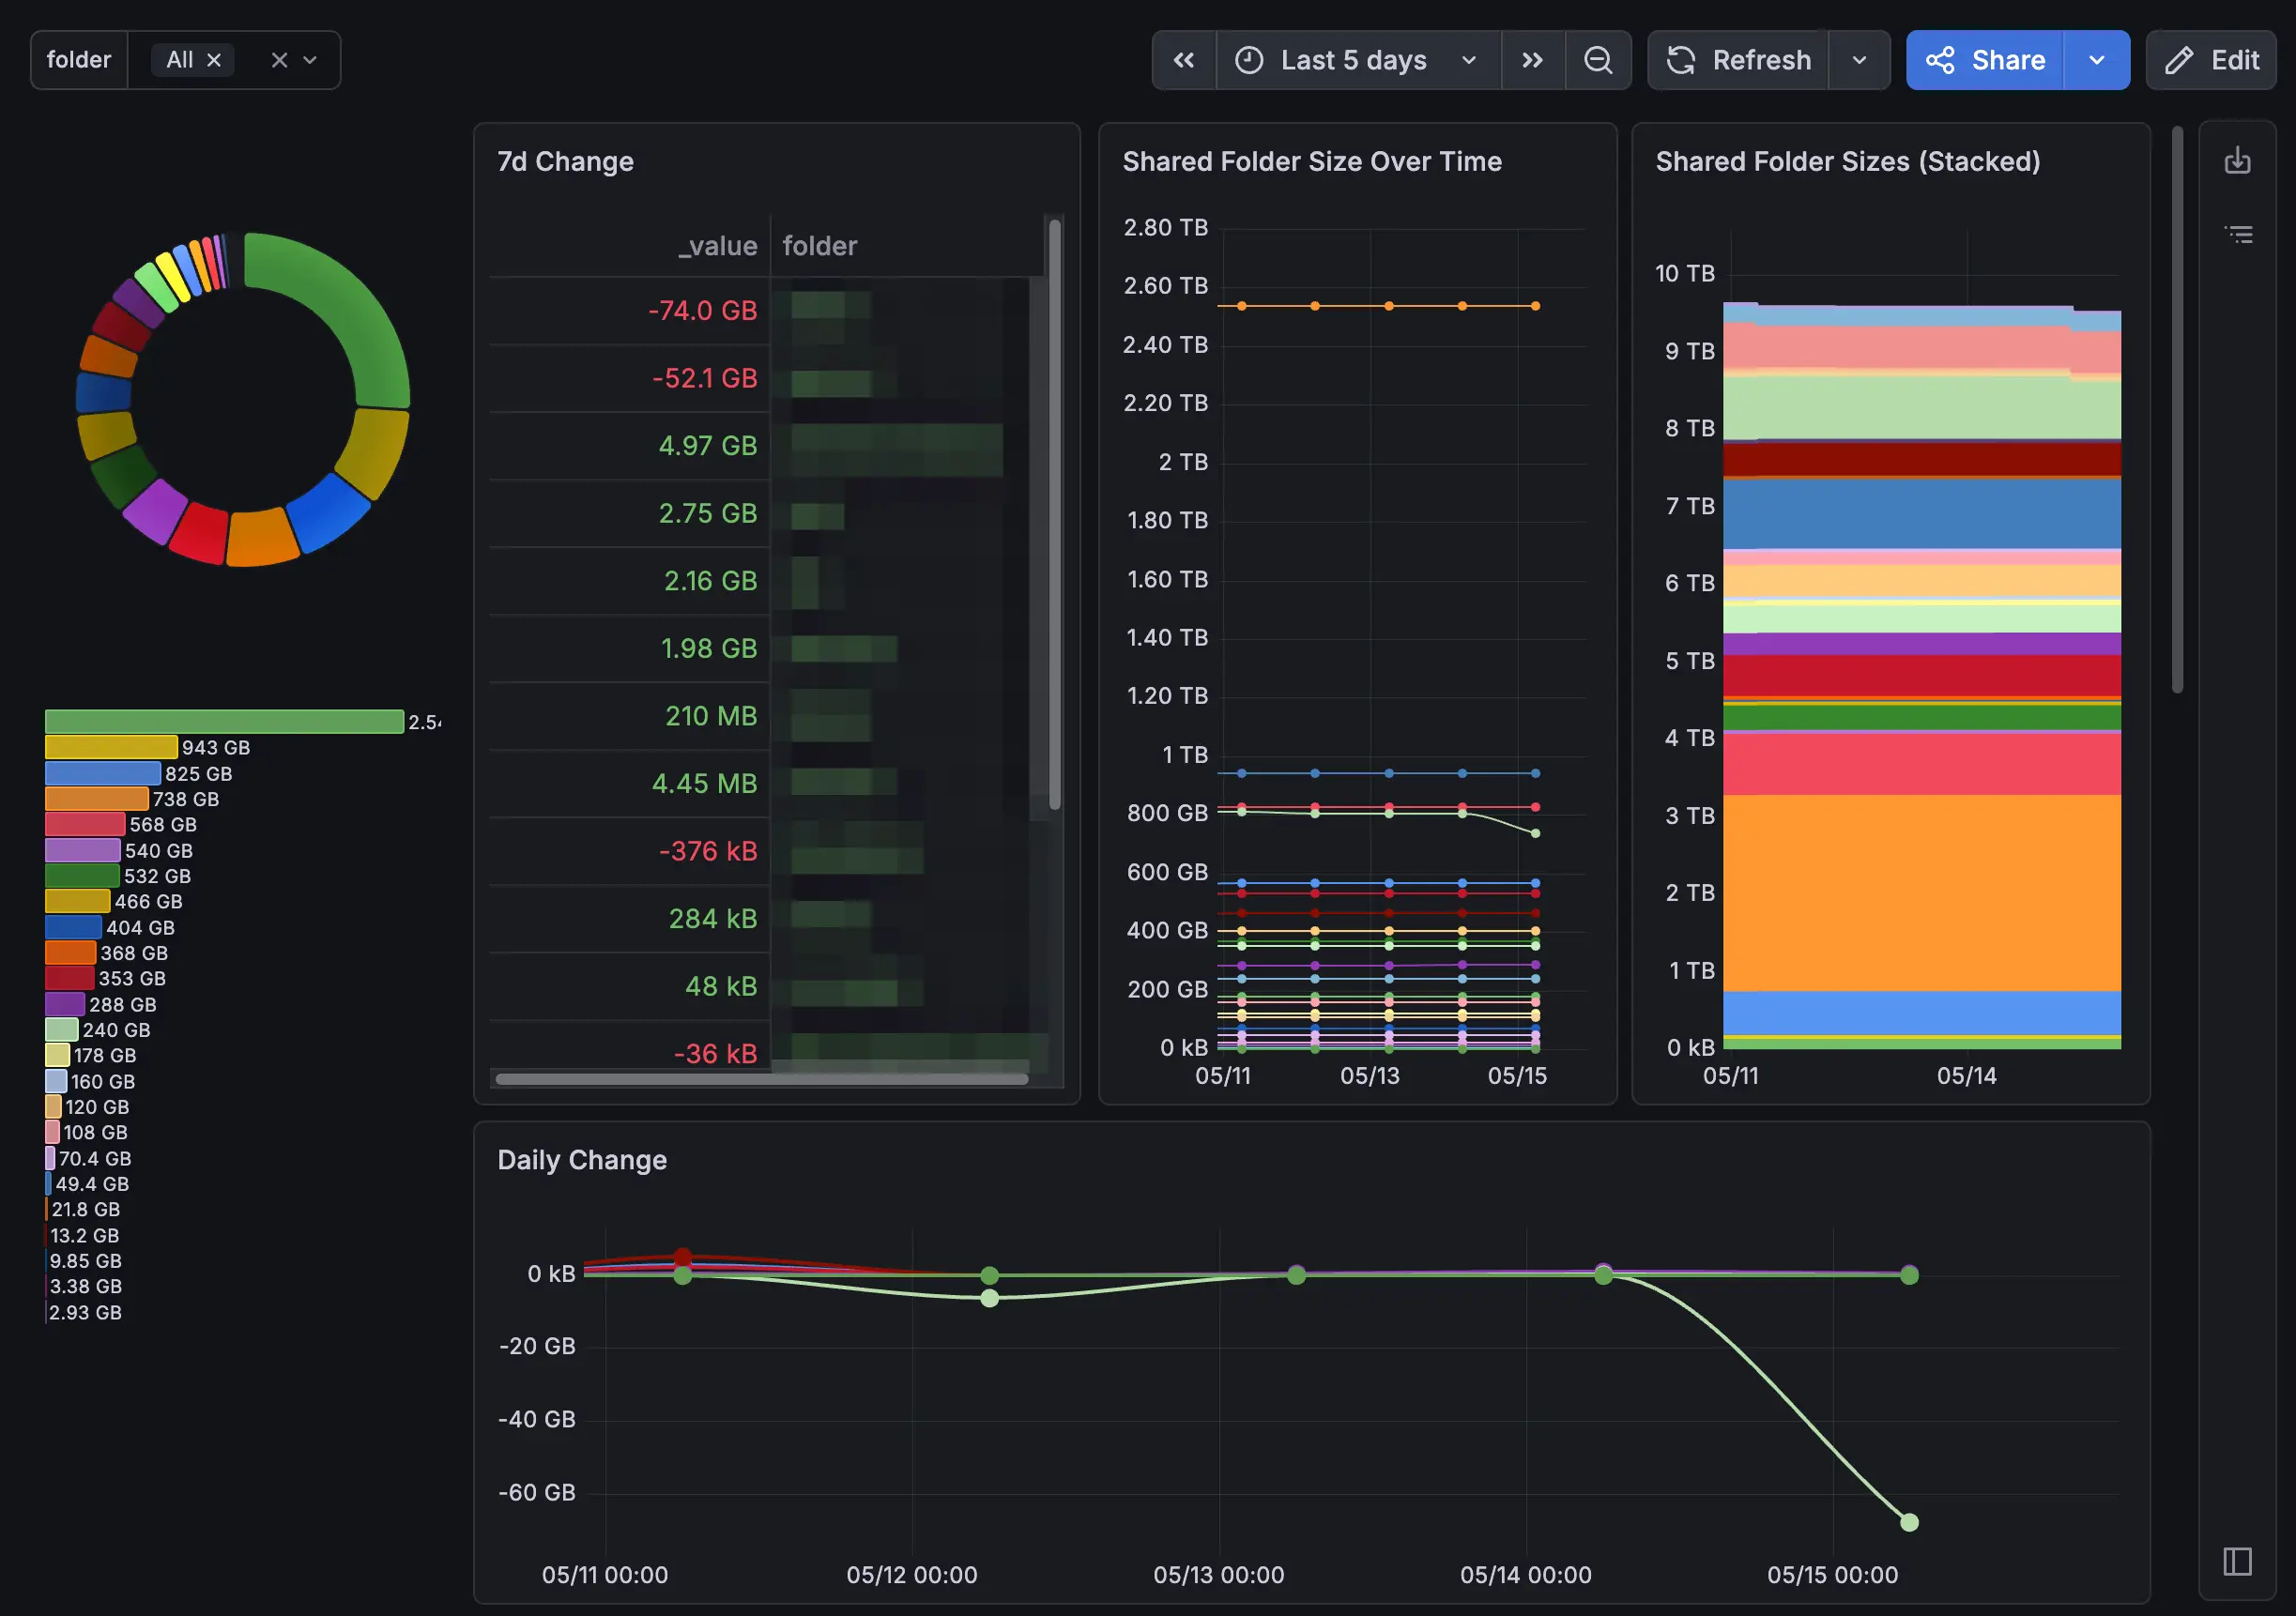
Final Dashboard
Conclusion
This has been a big help for me to identify which folders are growing over time, especially since the Storage Analyzer only shows a snapshot of the current state. By tracking trends, I can proactively manage my storage and investigate any unexpected growth before it becomes a problem.
If you have a better way to get folder size trends, let me know below.